Earnings Surprise Stock Price Calculator
Earnings Surprise Stock Price Calculator
What Is an Earnings Surprise Calculator & How Does It Work?
If you trade stocks or follow earnings season, you’ve probably heard the term “earnings surprise.” But what does it actually mean for your portfolio? An earnings surprise happens when a company reports actual earnings per share (EPS) that are different from what Wall Street analysts expected. This difference can move the stock price, sometimes dramatically.
Our Earnings Surprise Calculator helps you estimate that expected price movement before it happens. It takes three simple inputs and gives you an instant forecast. Let’s break down how it works and why it matters.
How to Use the Earnings Surprise Calculator (Real-Time Guide)
This tool is designed to be as simple as possible. Here’s a step-by-step walkthrough so you can get the most out of it.
Step 1: Enter the Expected EPS (Consensus Estimate)
The first field asks for the expected EPS. This is the Wall Street consensus estimate the average of all analyst forecasts for the quarter. You can find this number on financial websites like Yahoo Finance, Bloomberg, or your brokerage platform.
Just type the number into the box. For example, if analysts expect $1.20 per share, enter 1.20. The calculator will use this as your baseline.
Step 2: Input the Actual EPS (Reported Earnings)
Next, enter the actual EPS that the company just reported. This is the real number released in the earnings announcement. Again, you’ll find this in the company’s press release or on financial news sites.
For instance, if the company actually earned $1.45 per share, type 1.45. The calculator will instantly compute the surprise percentage by comparing this to your expected EPS.
Step 3: Set the Historical Price Reaction Multiplier
This is where you customize the forecast. The historical price reaction is the average percentage move the stock has shown for every 1% of EPS surprise in the past.
You can:
- Use a default value like 1.8 (common for many growth stocks)
- Research the stock’s history to find its specific reaction
- Adjust it based on market conditions or recent volatility
The typical range is between 0.5 and 3.0. A higher number means the stock is more sensitive to surprises and potentially more volatile.
Why EPS Surprise Matters for Stock Traders?
Earnings surprises are one of the biggest short-term drivers of stock prices. When a company beats expectations, investors often get excited and push the price up. When it misses, the opposite happens. But the size of the move isn’t always obvious. That’s where the EPS surprise formula comes in.
The formula calculates the percentage difference between actual EPS and expected EPS. For example, if analysts expected $1.00 per share and the company reports $1.20, that’s a 20% positive surprise. But a 20% surprise doesn’t always mean a 20% price move. The actual expected price movement depends on how the market typically reacts to surprises for that specific stock or sector.
Earning Surprise Stock Price Formula
Expected Price Movement = EPS Surprise % × Historical Price Reaction
The Formula Behind Expected Price Movement
Here’s the simple math the calculator uses:
EPS Surprise % = (Actual EPS – Expected EPS) ÷ |Expected EPS| × 100
Then:
Expected Price Movement = EPS Surprise % × Historical Price Reaction
The historical price reaction is a multiplier that reflects how sensitive the stock has been to past surprises. For instance, if a stock historically moves 1.5% for every 1% surprise, and the current surprise is 10%, the expected move would be 15%.
This is not a crystal ball, but it’s an educated estimate based on past behavior. But it gives you a data-driven starting point for your trading decisions.
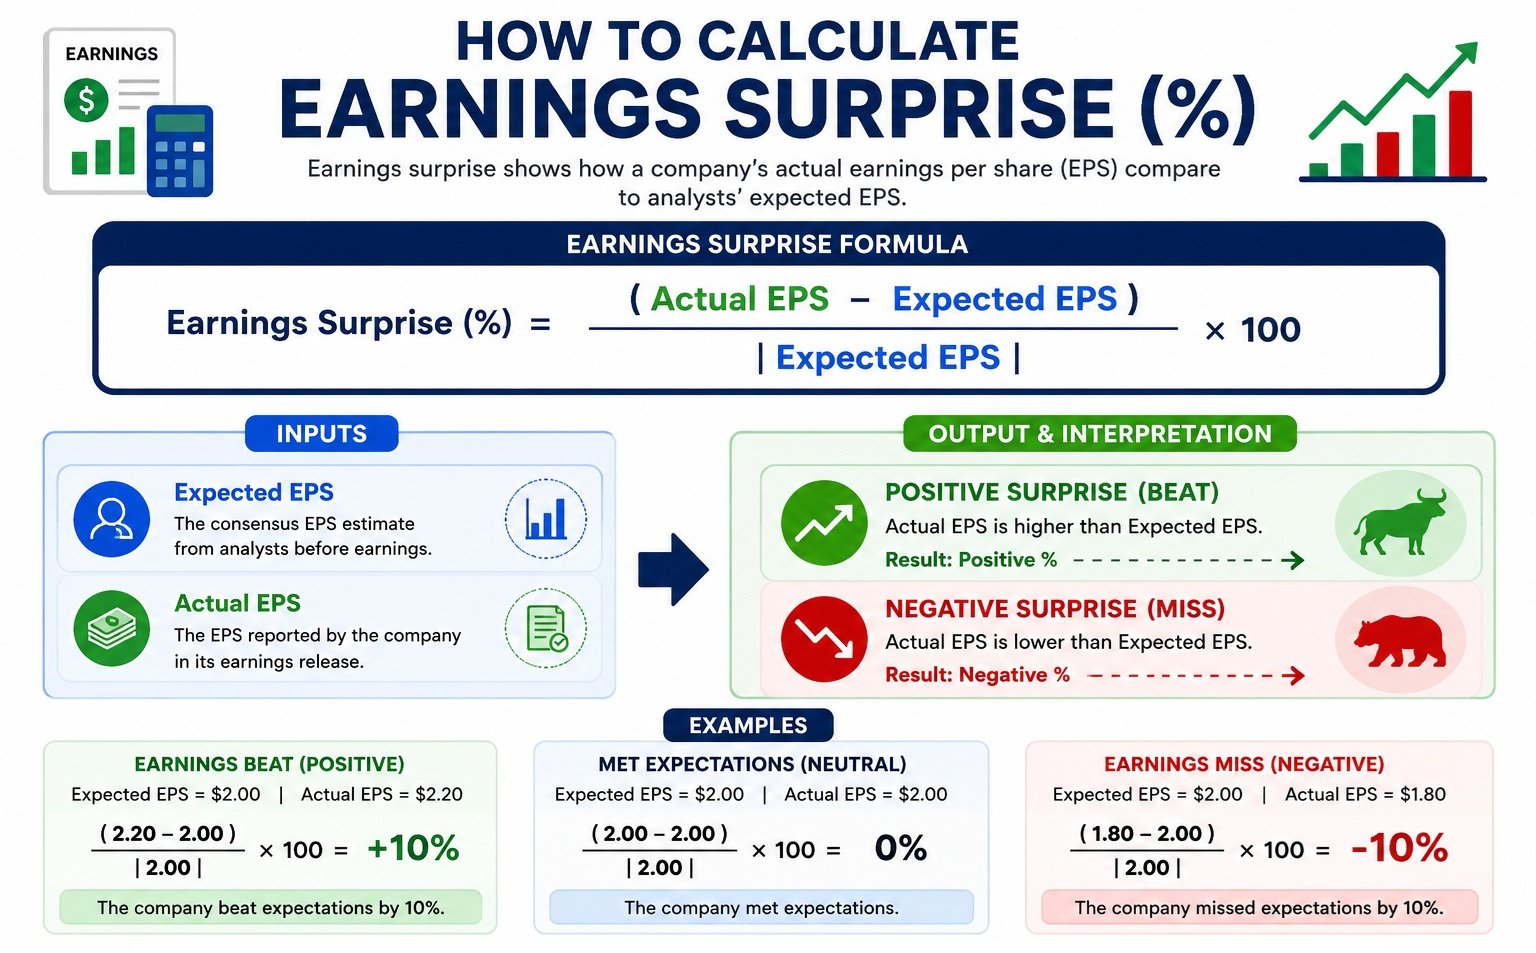
Earnings Surprise Interpretation Chart
An earnings surprise compares a company’s actual earnings per share (EPS) with the analysts’ expected EPS. A positive surprise (earnings beat) generally indicates the company performed better than expected, while a negative surprise (earnings miss) means earnings fell short of forecasts. Investors often use the earnings surprise percentage to evaluate quarterly performance and estimate how the market may react after an earnings announcement.
Although there is no guaranteed relationship between an earnings surprise and a stock’s future price, companies reporting large positive surprises often receive increased investor attention. Likewise, significant earnings misses may result in selling pressure, especially when accompanied by weak revenue growth or lower future guidance. The table below provides a general interpretation of common earnings surprise ranges.
| Earnings Surprise | Interpretation | Typical Market Reaction |
| > 20% | Exceptional Beat | Strong Bullish |
| 10% to 20% | Large Beat | Bullish |
| 5% to 10% | Moderate Beat | Moderately Bullish |
| 0% to 5% | Slight Beat | Slightly Bullish |
| 0% | Met Expectations | Neutral |
| -5% to 0% | Slight Miss | Slightly Bearish |
| -10% to -5% | Moderate Miss | Bearish |
| < -10% | Large Miss | Strongly Bearish |
This helps users interpret the surprise percentage, but actual stock reactions also depend on guidance, revenue, valuation, and market expectations.
How Historical Price Reaction Influences Forecasts
Not all stocks react the same way to earnings surprises. A tech stock might swing wildly, while a utility stock barely budges. That’s why the historical price reaction input is so important.
This number is usually calculated by looking at the average price move (in percentage terms) following past earnings surprises. For example:
- If a stock moved +2% on average after a 1% positive surprise, the reaction is 2.0.
- If it moved -1.5% after a 1% negative surprise, the reaction is still 1.5 (we use the absolute value).
By entering this number, you’re tailoring the forecast to the specific stock or sector you’re analyzing. The more accurate your reaction estimate, the more reliable your expected price movement projection will be.
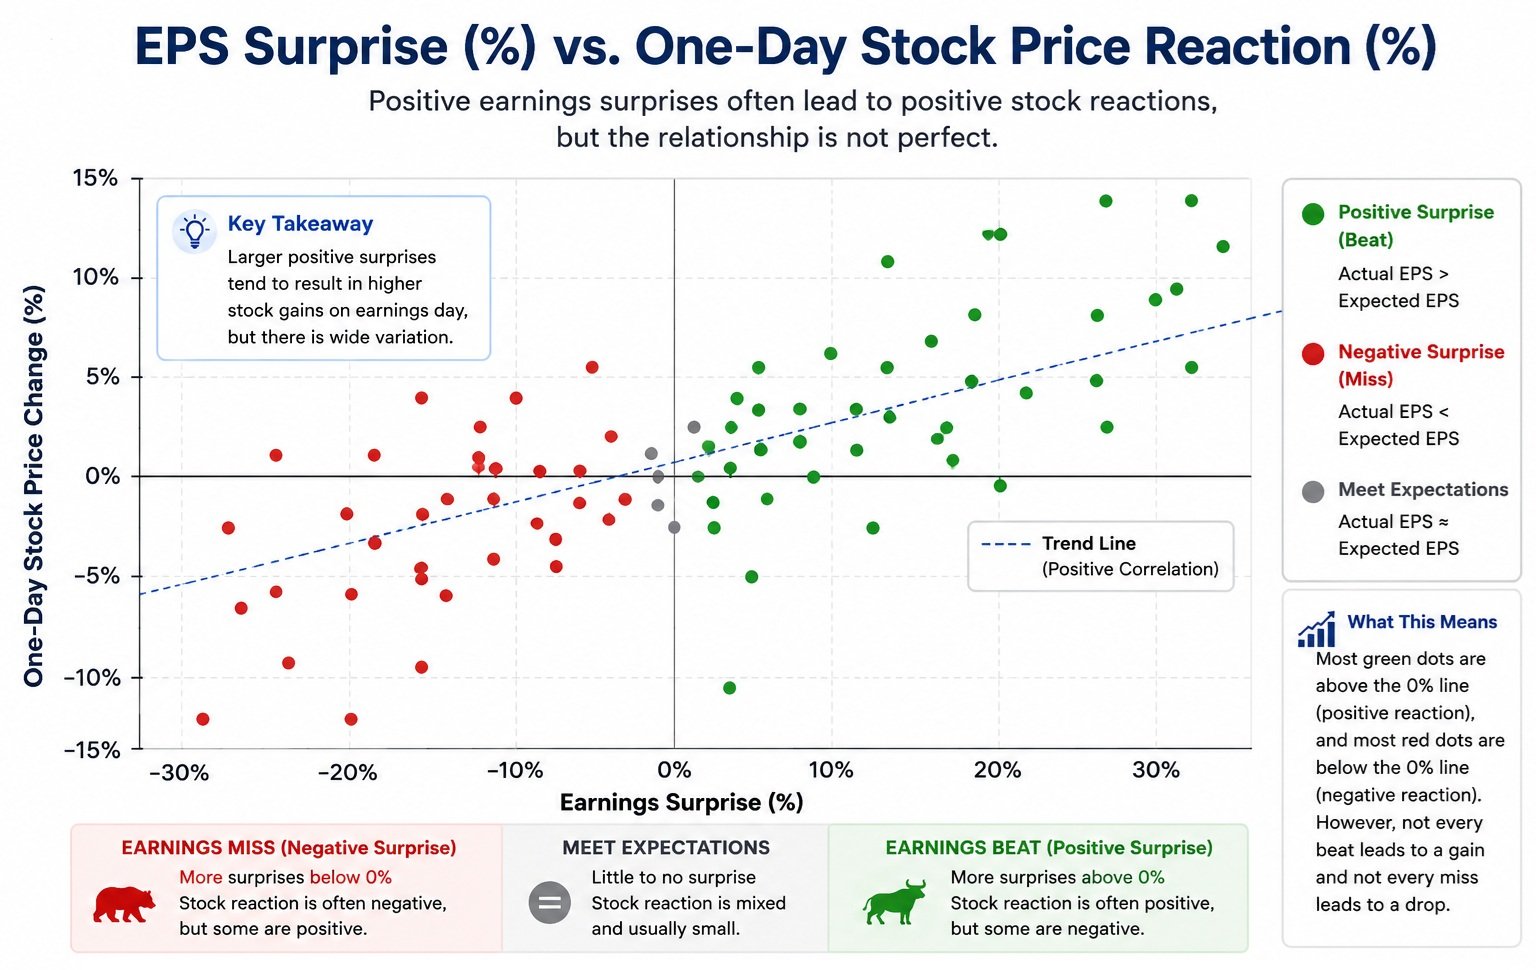
Stock Price Reaction Scatter Plot
This chart shows the relationship between an earnings surprise and the one-day stock price reaction after a company reports earnings. The green dots represent companies that reported better-than-expected earnings (positive surprise), while the red dots represent worse-than-expected earnings (negative surprise). The upward trend line suggests that larger positive earnings surprises often lead to higher stock price gains. However, the scattered dots show that stock prices do not always move as expected because factors such as revenue, company guidance, market conditions, and investor sentiment also influence the market’s reaction.
Why Earnings Surprise Drives Stock Price Volatility
Earnings surprises don’t just move prices—they often create the biggest trading opportunities of the quarter. Understanding why this happens can help you trade more confidently and manage risk better.
The Psychology Behind Positive vs. Negative Surprises
Markets are driven by expectations. When a company beats expectations, it signals that the business is stronger than analysts thought. This creates a wave of buying as investors rush to get in. Conversely, a miss suggests weakness, triggering selling.
But the psychology goes deeper. A small beat might not move the stock much if the market was already expecting it. A huge beat, however, can cause a massive rally. The same logic applies to misses. That’s why the EPS surprise formula alone isn’t enough—you also need to consider how the market typically reacts, which is where the historical price reaction comes in.
How to Interpret the Expected Price Movement Percentage
The final number—the expected price movement—tells you the potential percentage change in the stock price. For example, if the calculator shows +4.5%, that means the model expects the stock to rise about 4.5% based on historical patterns.
This is useful for:
- Setting price targets before earnings
- Deciding whether to hold, buy, or sell
- Comparing different stocks to see which has more upside potential
Keep in mind this is an estimate, not a guarantee. External factors like overall market sentiment, guidance, and news can override historical patterns.
Earnings Beat vs. Earnings Miss – What’s the Difference?
When a company reports earnings, two things can happen: a beat or a miss. A beat means the actual EPS came in higher than what analysts expected. A miss means it came in lower. These two outcomes can have very different effects on the stock price and investor behavior.
Here’s a quick comparison to help you understand the key differences:
| Metric | Earnings Beat | Earnings Miss |
| Actual EPS | Higher | Lower |
| Expected EPS | Lower | Higher |
| Surprise | Positive | Negative |
| Investor Sentiment | Positive | Negative |
| Stock Trend | Often Up | Often Down |
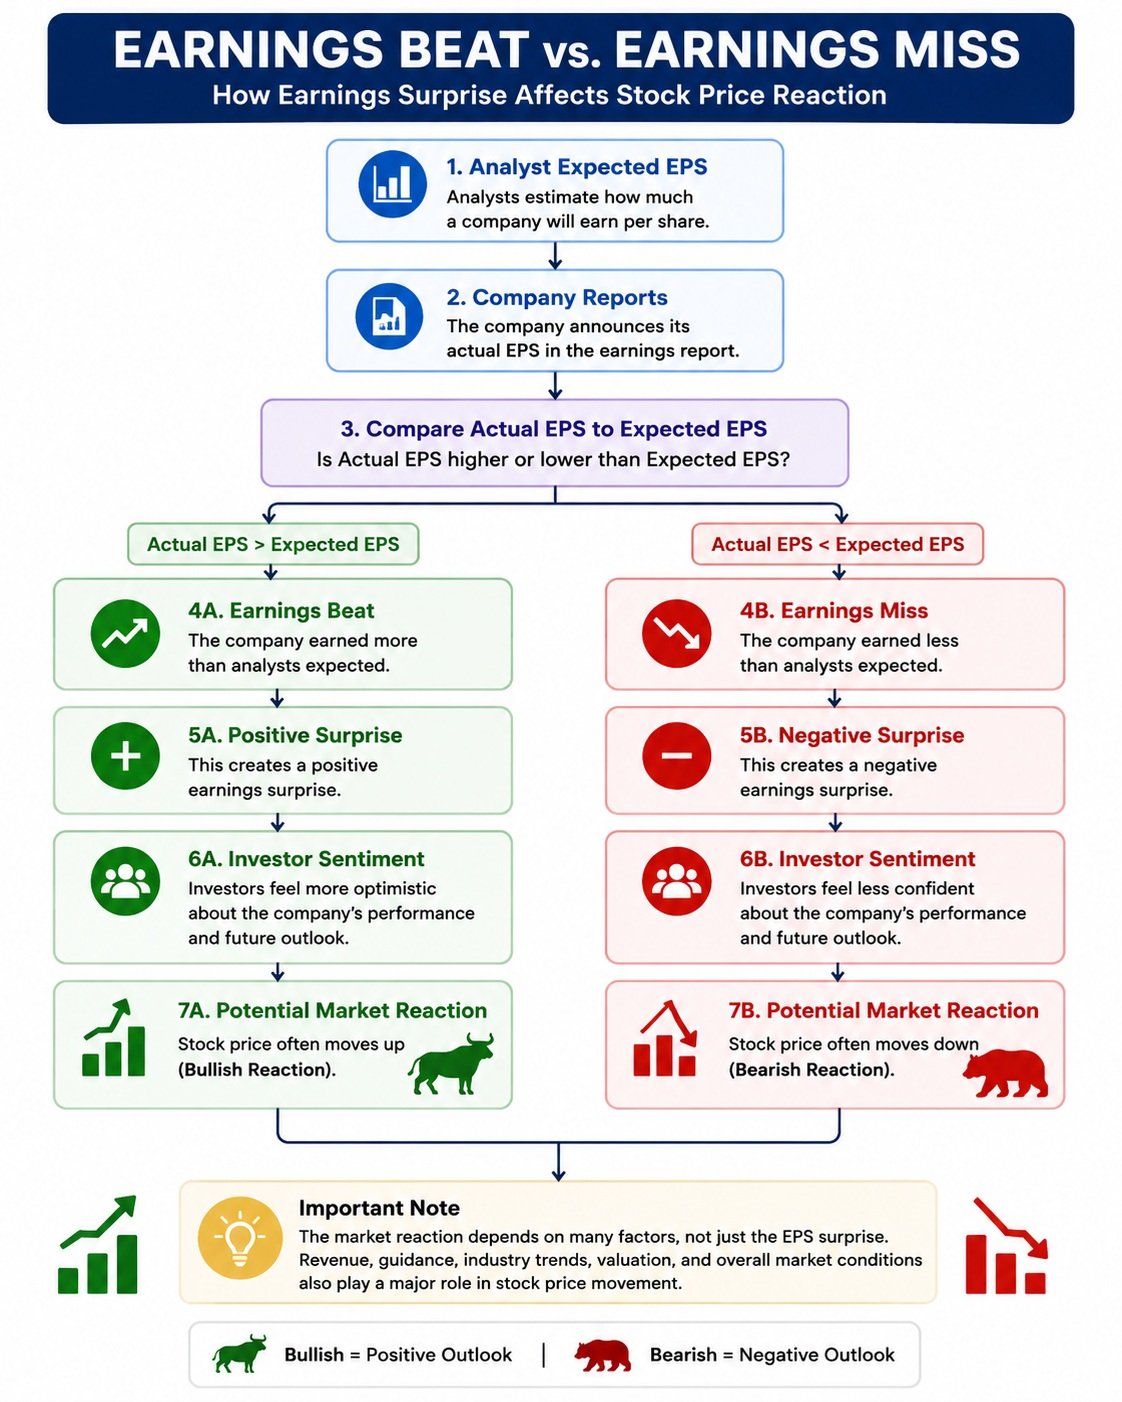
Earnings Beat vs Earnings Miss Flowchart
This Earnings Beat vs. Earnings Miss Flowchart explains how companies are evaluated after reporting quarterly earnings. Analysts first estimate the expected earnings per share (EPS). When the company reports its actual EPS, the result is compared with the estimate. If the actual EPS is higher, it is called an earnings beat or positive earnings surprise, which may improve investor confidence and support a bullish stock price reaction. If the actual EPS is lower than expected, it is an earnings miss or negative earnings surprise, which may lead to bearish sentiment. However, revenue growth, forward guidance, valuation, and overall market conditions also play an important role in determining the stock’s actual price movement after earnings.
Combining the Calculator with Technical & Fundamental Analysis
The Earnings Surprise Calculator is a powerful tool, but it works best when combined with other analysis methods. For example:
- Technical analysis can help you identify support and resistance levels that might limit or amplify the move.
- Fundamental analysis tells you whether the company’s underlying business is strong or weak—which can affect how the market interprets a surprise.
Use the calculator as one piece of the puzzle. It gives you a data-driven starting point, but always consider the bigger picture.
Combining the Calculator with Technical & Fundamental Analysis
The Earnings Surprise Calculator is a powerful tool, but it works best when combined with other analysis methods. For example:
- Technical analysis can help you identify support and resistance levels that might limit or amplify the move.
- Fundamental analysis tells you whether the company’s underlying business is strong or weak—which can affect how the market interprets a surprise.
Use the calculator as one piece of the puzzle. It gives you a data-driven starting point, but always consider the bigger picture.
Common Mistakes to Avoid When Estimating Price Reactions
Even experienced traders make errors when using calculators like this.
Here are a few pitfalls to watch out for:
- Using the wrong historical reaction: Make sure you’re using a reaction that matches the stock’s recent behavior, not something from years ago.
- Ignoring market conditions: A high reaction during a bull market might not apply during a bear market.
- Forgetting about guidance: Sometimes the stock moves more on future guidance than on the surprise itself.
- Overconfidence: Remember, this is a probability, not a certainty. Always set stop-losses and manage your risk.
Frequently Asked Questions (FAQs)
1. What is an earnings surprise calculator?
An Earnings Surprise Calculator compares a company's actual earnings per share (EPS) with the expected EPS forecast. It calculates the earnings surprise percentage and helps investors evaluate whether the company reported an earnings beat or an earnings miss.
2. How do you calculate an earnings surprise?
The earnings surprise percentage is calculated using the following formula:
Earnings Surprise (%) = ((Actual EPS − Expected EPS) ÷ |Expected EPS|) × 100
A positive result indicates an earnings beat, while a negative result indicates an earnings miss.
3. What is considered a positive earnings surprise?
A positive earnings surprise occurs when a company's actual EPS is higher than analysts' consensus estimate. Companies that consistently report positive earnings surprises may experience increased investor confidence and stronger stock price performance.
4. What is a negative earnings surprise?
A negative earnings surprise occurs when the reported EPS is lower than analysts expected. Depending on market expectations and company guidance, a negative surprise can result in downward pressure on the stock price.
5. Does a positive earnings surprise always increase a stock's price?
No. While positive earnings surprises often lead to stock price gains, market reaction also depends on revenue growth, future guidance, valuation, investor expectations, and overall market conditions.
6. What information is needed to use an earnings surprise calculator?
You typically need the expected EPS (analyst estimate) and the actual reported EPS. Some advanced calculators also estimate the potential stock price reaction using historical earnings data.
7. Why is earnings surprise important for investors?
Earnings surprises provide insight into whether a company performed better or worse than expected. Investors often use this information to evaluate company performance, revise earnings forecasts, and make investment decisions.
8. Can this calculator estimate stock price movement after earnings?
Yes. If a historical price reaction factor is included, the calculator can estimate a potential stock price movement based on the size of the earnings surprise. Actual market performance may differ because many other factors influence stock prices.
9. What is the difference between expected EPS and actual EPS?
Expected EPS is the average earnings forecast provided by financial analysts before a company reports earnings. Actual EPS is the earnings per share reported by the company in its official earnings release.
10. How accurate is an earnings surprise calculator?
An Earnings Surprise Calculator accurately calculates the earnings surprise percentage based on the values entered. However, any estimate of future stock price movement is only a projection and should not be considered financial advice or a guarantee of future performance.
References
- U.S. Securities and Exchange Commission (SEC). Earnings Per Share (EPS) – Investor.gov. Covers the definition and calculation of earnings per share (EPS), a key input for earnings surprise calculations.
- Nasdaq. Earnings Surprises Definition. Explains positive and negative earnings surprises and discusses how earnings surprises can influence stock prices.
- Nasdaq. Earnings Per Share (EPS) Definition. Provides details on EPS, EPS growth, and analyst earnings estimates used in valuation and earnings analysis.
- U.S. Securities and Exchange Commission (SEC). SEC Financial Glossary. Official glossary covering EPS, financial reporting terminology, and concepts commonly used in quarterly earnings reports.
- Federal Reserve Board. Soft Information in Earnings Announcements: News or Noise?. Academic research examining earnings surprises, analyst forecasts, standardized unexpected earnings, and stock price reactions following earnings announcements.