Standard Deviation Calculator with Step-by-Step Solution
Standard Deviation Calculator
Results
What Is Standard Deviation?
Standard deviation is a number that tells you how spread out your data is. Imagine you have a set of numbers, like test scores. If everyone scored close to the same mark, the standard deviation will be small. But if some students scored very high and others scored very low, the standard deviation will be large.
Think of it as a measure of “average distance from the average.” It takes the mean (the central value) and then checks how far each data point is from that mean. It squares those differences, averages them, and then takes the square root. This gives you a single number that summarizes the variability in your data. In everyday life, standard deviation is used everywhere—from quality control in factories to predicting stock market risks. It helps you understand if your data is consistent or all over the place.
Standard Deviation Formula
The formula for standard deviation looks a bit scary at first, but it’s actually quite logical. For a population, it is written as σ = √( Σ (x – μ)² / N ).
Here,
- σ (sigma) is the standard deviation,
- μ (mu) is the mean of the data,
- N is the total number of data points, and
- Σ means “sum up.”
So, what does this formula do step by step? First, it finds the mean of your data. Then, for every single data point, it subtracts the mean and squares the result (to get rid of any negative signs). Next, it adds all those squared values together. After that, it divides that total by the number of data points to get the average squared distance, which is called the variance. Finally, it takes the square root of that variance to bring the number back to the original unit of measurement. This makes the standard deviation much easier to interpret than variance.
Sample vs Population Standard Deviation
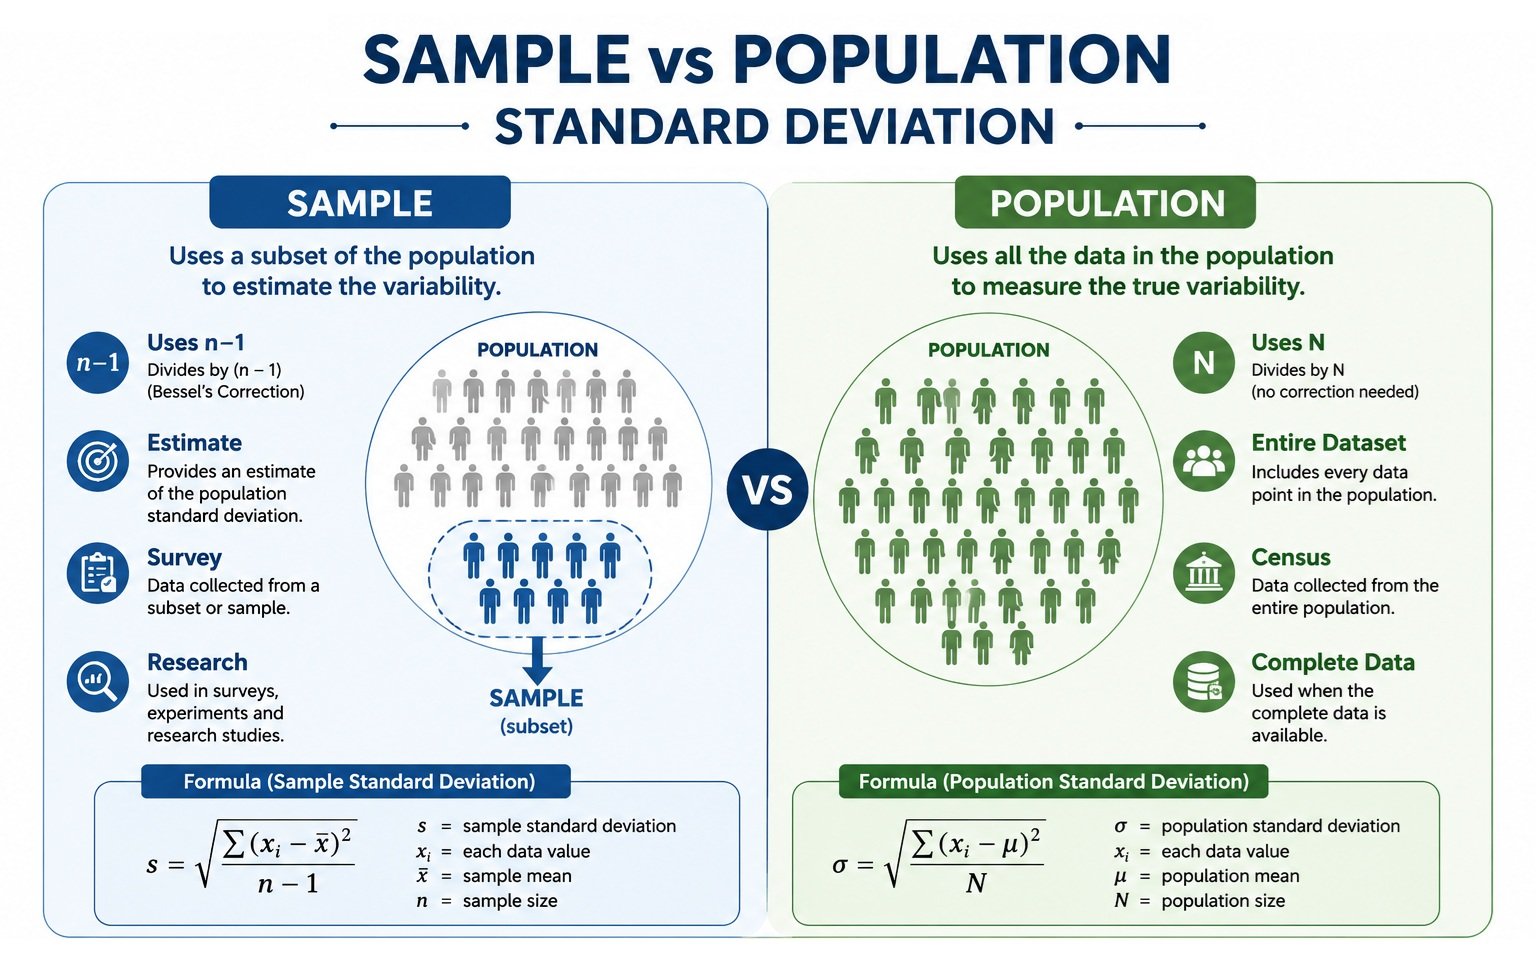
One of the most common points of confusion is the difference between sample and population standard deviation. The population standard deviation is used when you have data for every single member of a group. For example, if you are a teacher and you have test scores for all 30 students in your class, you would use the population formula.
However, in real life, we often only have a sample of a larger group. For instance, if you wanted to know the average height of all adults in your city, you wouldn’t measure everyone. You would take a sample of a few hundred people. Because a sample gives you a little less information, the formula changes slightly. Instead of dividing by N (the total number in the population), you divide by N – 1 (the sample size minus one). This small adjustment gives you a slightly larger standard deviation, which better estimates the true spread of the entire population. It’s a way to be more honest about the uncertainty in your data.
Population Standard Deviation Formula
Sample Standard Deviation Formula
| Feature | Sample Standard Deviation | Population Standard Deviation |
| Definition | Measures variability of a sample taken from a larger population. | Measures variability of the entire population. |
| Data Used | Only a subset (sample) of all observations. | Every observation in the population. |
| Formula Symbol | s | σ (Sigma) |
| Variance Formula | Σ(x − x̄)² ÷ (n − 1) | Σ(x − μ)² ÷ N |
| Standard Deviation Formula | s = √[Σ(x − x̄)² / (n − 1)] | σ = √[Σ(x − μ)² / N] |
| Mean Symbol | x̄ (Sample Mean) | μ (Population Mean) |
| Denominator | n − 1 (Bessel’s Correction) | N |
| Why n − 1? | Reduces bias and provides a better estimate of the population variance. | No correction needed because every value is included. |
| When to Use | Surveys, experiments, research studies, quality sampling, polls. | Census data, complete databases, entire class or company records. |
| Typical Example | Heights of 50 students selected from a school. | Heights of every student in the school. |
| Accuracy | Estimates the population standard deviation. | Exact standard deviation of the population. |
| Common Applications | Statistics, machine learning, hypothesis testing, research. | Manufacturing, finance, census analysis, quality control. |
How to Calculate Standard Deviation (Real Life Like Example)
Let’s be honest, reading about standard deviation is one thing, but actually doing the math yourself is how it really clicks. Don’t worry, we’re going to walk through it together using a simple, everyday example. No jargon, just plain numbers.
Imagine you are a small business owner, and you want to figure out how consistent your daily sales are. You look at the last five days and see these sales figures: $200, $240, $220, $230, and $210.
Here is how we find the standard deviation step by step.
Step 1: Find the mean (the average).
Add up all your sales: 200 + 240 + 220 + 230 + 210 = 1100.
Now divide by the number of days, which is 5. So, 1100 ÷ 5 = 220.
On average, you make $220 per day. Keep that number in mind.
Step 2: Subtract the mean from each number and square the result.
We do this to find out how far each day’s sales are from the average.
- Day 1: 200 – 220 = -20 → (-20)² = 400
- Day 2: 240 – 220 = 20 → (20)² = 400
- Day 3: 220 – 220 = 0 → (0)² = 0
- Day 4: 230 – 220 = 10 → (10)² = 100
- Day 5: 210 – 220 = -10 → (-10)² = 100
Now we have a list of squared differences: 400, 400, 0, 100, and 100.
Step 3: Find the average of those squared differences.
Add them up: 400 + 400 + 0 + 100 + 100 = 1000.
Divide by the number of days (5): 1000 ÷ 5 = 200.
This number (200) is called the variance. It tells us the average squared distance from the mean, but it’s in “squared dollars,” which doesn’t make much sense in real life.
Step 4: Take the square root.
To bring it back to regular dollars, we take the square root of 200.
√200 ≈ 14.14.
That’s your standard deviation! It means that on a typical day, your sales fluctuate by about $14.14 above or below your average of $220.
Some days you sell a bit more, some days a bit less, but the usual swing is roughly fourteen bucks.
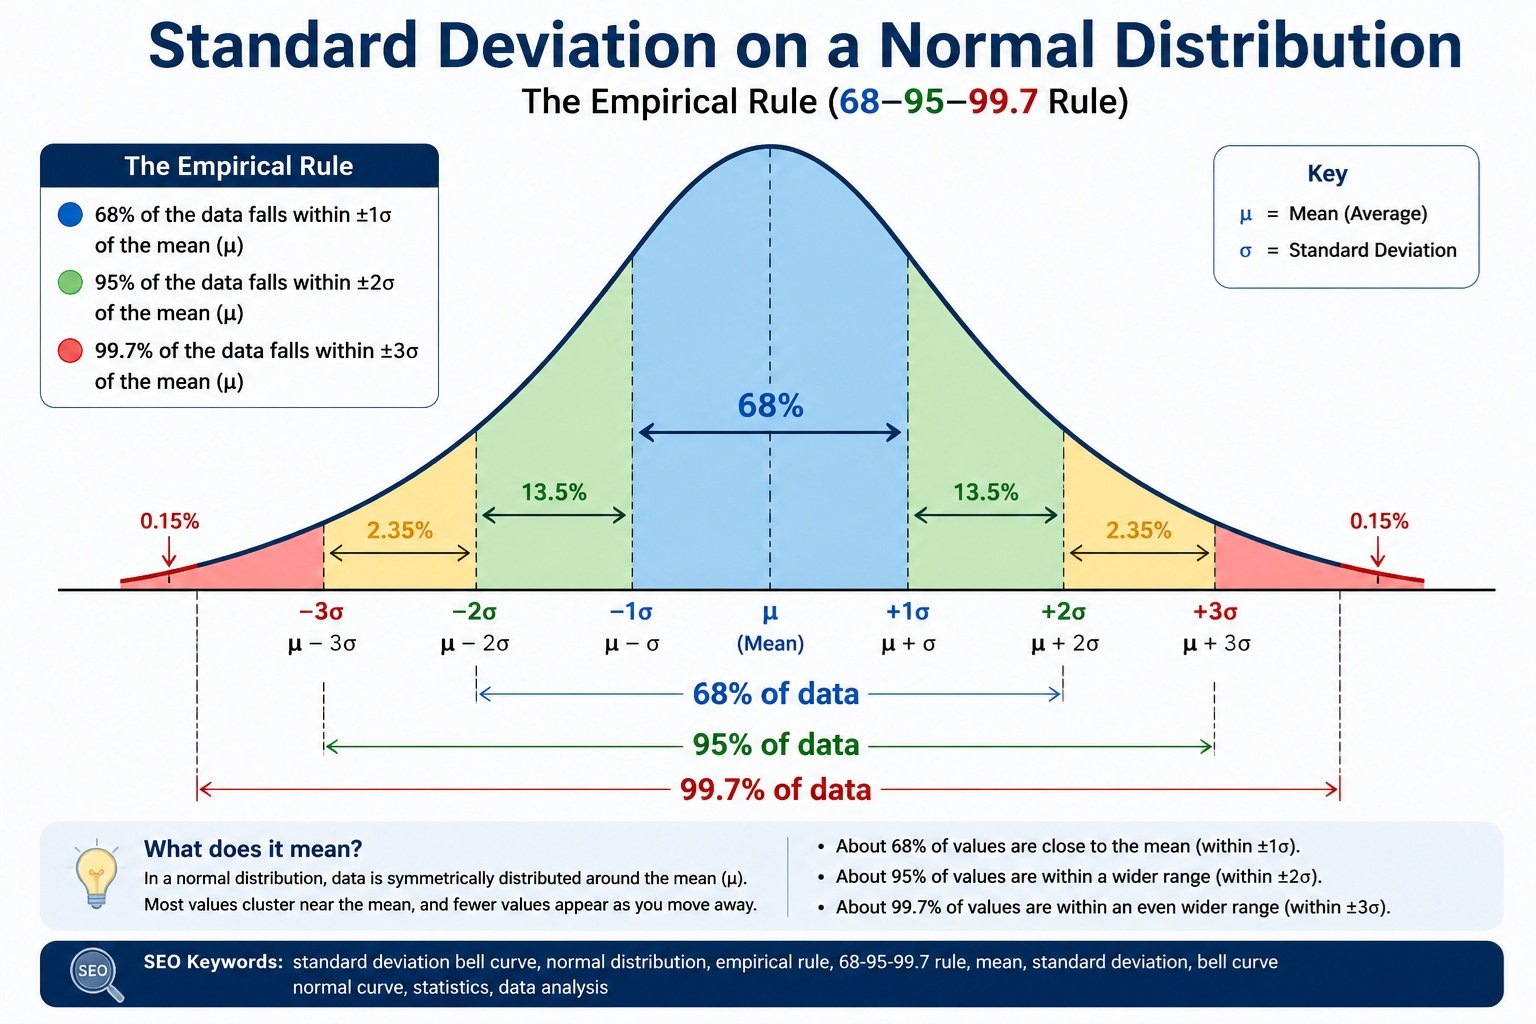
Standard Deviation and the Normal Distribution
Distance from Mean | Approximate Data Included | Interpretation |
| Mean (μ) | Peak of the distribution | Average value |
| ±1 Standard Deviation (±1σ) | 68.27% | Most observations fall within this range |
| ±2 Standard Deviations (±2σ) | 95.45% | Nearly all observations fall within this range |
| ±3 Standard Deviations (±3σ) | 99.73% | Almost every observation falls within this range |
| Beyond ±3σ | 0.27% | Often considered rare values or potential outliers |
When Should You Use Standard Deviation?
You should use standard deviation whenever you need to understand how reliable or consistent your data is. It’s especially useful when you want to compare two sets of numbers that have similar averages but very different spreads.
For example, if you are a manager looking at the productivity of two employees, both might complete the same number of tasks per week on average. But if one employee has a low standard deviation, you know they are steady and predictable. If the other has a high standard deviation, their performance is up and down—some weeks great, some weeks poor. That tells you who needs more support or training.
Standard deviation is also helpful in finance. If you are choosing between two mutual funds with the same average return, the one with the lower standard deviation is safer because it doesn’t swing as wildly.
It’s also used in quality control, healthcare, and even sports analytics. Basically, any time you hear someone say “risk,” “consistency,” or “spread,” standard deviation is probably the right tool for the job. Just remember, it works best with numerical data that follows a normal, bell-shaped curve.
Standard Deviation Interpretation Chart
Standard Deviation (σ) | Level of Variability | Interpretation | Example |
| 0 | No Variation | Every value in the dataset is exactly the same as the mean. | Test scores: 80, 80, 80, 80 |
| Very Low (Close to 0) | Very Consistent | Data points are tightly clustered around the mean with very little spread. | Machine parts with nearly identical dimensions |
| Low | Slight Variation | Most values are close to the average with only small differences. | Student quiz scores in a consistent class |
| Moderate | Normal Variation | Data shows a reasonable amount of spread around the mean. | Heights of adult men or women |
| High | Large Variation | Values are spread far from the mean, indicating greater diversity. | Household incomes across a city |
| Very High | Extreme Variation | Data is highly dispersed with significant differences between observations. | Stock market returns or cryptocurrency prices |
Mean vs. Median vs. Mode Explained
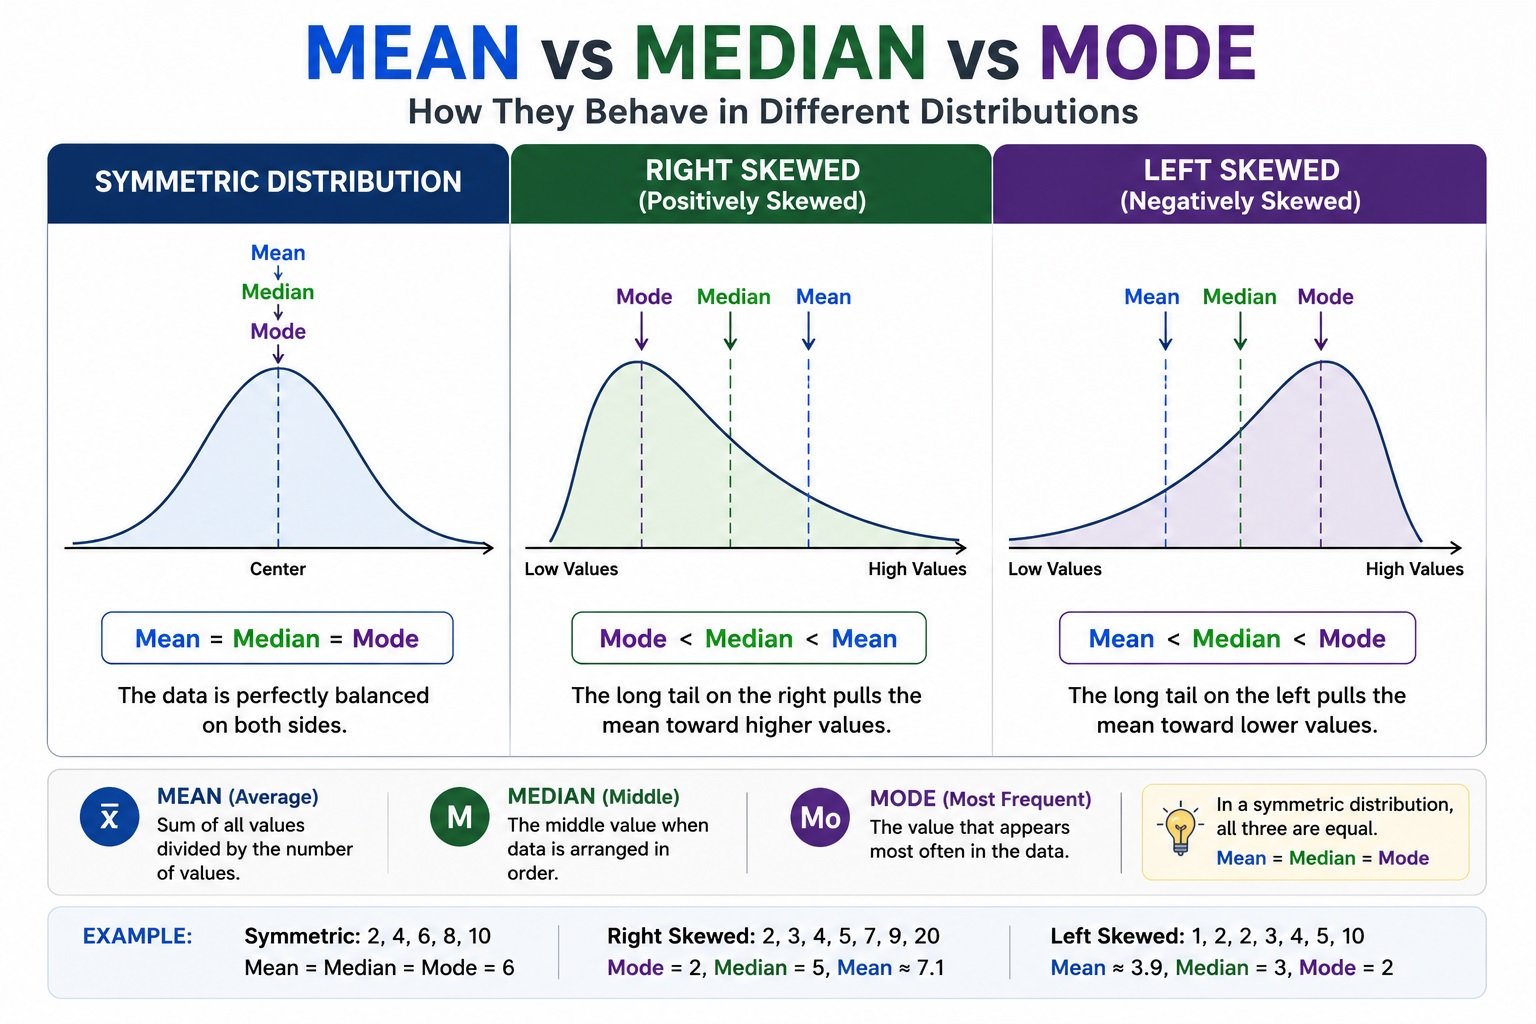
The chart above shows how the mean, median, and mode change depending on the shape of a data distribution. These three measures of central tendency help describe the center of a dataset, but they do not always have the same value.Definition:
- The mean is the arithmetic average of all values in a dataset. It is calculated by adding every value together and dividing by the total number of observations.
Formula: Mean = Sum of all values ÷ Number of values
- Median: The median is the middle value after arranging the data in ascending or descending order. If there is an even number of observations, the median is the average of the two middle values.
Example: Data: 3, 5, 7, 9, 20 (Median = 7)
- Mode: The mode is the value that appears most frequently in a dataset. A dataset may have one mode, more than one mode, or no mode if every value occurs only once.
Example: Data: 2, 4, 4, 5, 6, 6, 6, 8 (Mode = 6)
| Feature | Mean | Median | Mode |
| Definition | Arithmetic average | Middle value |
Most frequent value
|
| Calculation | Sum of values ÷ Number of values | Middle observation after sorting |
Value occurring most often
|
| Best For | Symmetric data | Skewed data |
Most common value
|
Symmetric Distribution
In a symmetric (normal) distribution, the data is evenly spread around the center. Because there is no skew, the mean, median, and mode all occur at the same point.
Relationship: Mean = Median = Mode
Example: Heights of adults or standardized test scores often follow a roughly symmetric distribution.
Right-Skewed (Positively Skewed) Distribution
A right-skewed distribution has a long tail extending toward larger values. A few unusually high observations pull the mean to the right.
Relationship: Mode < Median < Mean
In this case:
- Mode remains near the highest peak.
- Median stays near the middle of the data.
- Mean is pulled toward the high-value outliers.
Example: Household income, home prices, and medical costs are commonly right-skewed.
Left-Skewed (Negatively Skewed) Distribution
A left-skewed distribution has a long tail extending toward smaller values. A few unusually low observations pull the mean to the left.
Relationship: Mean < Median < Mode
In this case:
- Mean shifts toward the lower values.
- Median remains near the center.
- Mode stays at the highest point of the distribution.
Example: Retirement age or scores on an easy exam may produce a left-skewed distribution.
Frequently Asked Questions
1. What is standard deviation?
Standard deviation is a statistical measure that shows how far data values are spread from the mean (average). A low standard deviation means values are close to the mean, while a high standard deviation indicates greater variability.
2. How do you calculate standard deviation?
To calculate standard deviation, first find the mean of the dataset. Next, subtract the mean from each value, square each difference, calculate the variance, and then take the square root of the variance. Our Standard Deviation Calculator performs these steps automatically.
3. What is the difference between sample and population standard deviation?
Sample standard deviation uses n − 1 in the denominator because it estimates variability from a sample. Population standard deviation uses N because it includes every value in the population.
4. When should I use sample standard deviation?
Use sample standard deviation when your data represents only a portion of a larger population, such as survey results, research studies, or experiments.
5. When should I use population standard deviation?
Use population standard deviation when your dataset includes every member of the population you want to analyze, such as a complete census or the test scores of an entire class.
6. What does a high standard deviation mean?
A high standard deviation means the data values are widely spread from the mean. This indicates greater variability, less consistency, and larger differences between observations.
7. What does a low standard deviation mean?
A low standard deviation means most values are close to the mean. This indicates the data is consistent and has little variation.
8. What is the relationship between variance and standard deviation?
Variance measures the average squared distance from the mean, while standard deviation is simply the square root of the variance. Unlike variance, standard deviation is expressed in the same units as the original data.
9. Can standard deviation be negative?
No. Standard deviation is always zero or positive because it is calculated by taking the square root of the variance. A value of zero means every observation is identical.
10. Why is standard deviation important?
Standard deviation helps measure the consistency and reliability of data. It is widely used in statistics, finance, healthcare, education, engineering, manufacturing, quality control, and machine learning to understand data variability and compare datasets.
References
-
OpenStax – Introductory Business Statistics 2e: Measures of the Spread of the Data
https://openstax.org/books/introductory-business-statistics-2e/pages/2-7-measures-of-the-spread-of-the-data -
National Center for Education Statistics (NCES) – Standard Deviation
https://nces.ed.gov/nationsreportcard/NDEHelp/WebHelp/standard_deviation.htm -
National Library of Medicine (NLM) – Finding and Using Health Statistics: Standard Deviation
https://www.nlm.nih.gov/oet/ed/stats/02-900.html -
American Psychological Association (APA) Dictionary of Psychology – Standard Deviation
https://dictionary.apa.org/standard-deviation -
Penn State Eberly College of Science – Statistics Online (STAT 200): Measures of Variability
https://online.stat.psu.edu/stat200/lesson/2/2.3